Food safety guide
We Analysed 475,326 UK Food Hygiene Ratings. Here's Why Businesses Fail.
We analysed 475,326 food hygiene ratings to find out why businesses score below 5. The number one reason isn't dirty kitchens — it's paperwork.
20 March 2026
We analysed 475,326 food hygiene ratings across England, Wales, and Northern Ireland to answer a simple question: why do businesses fail food hygiene inspections?
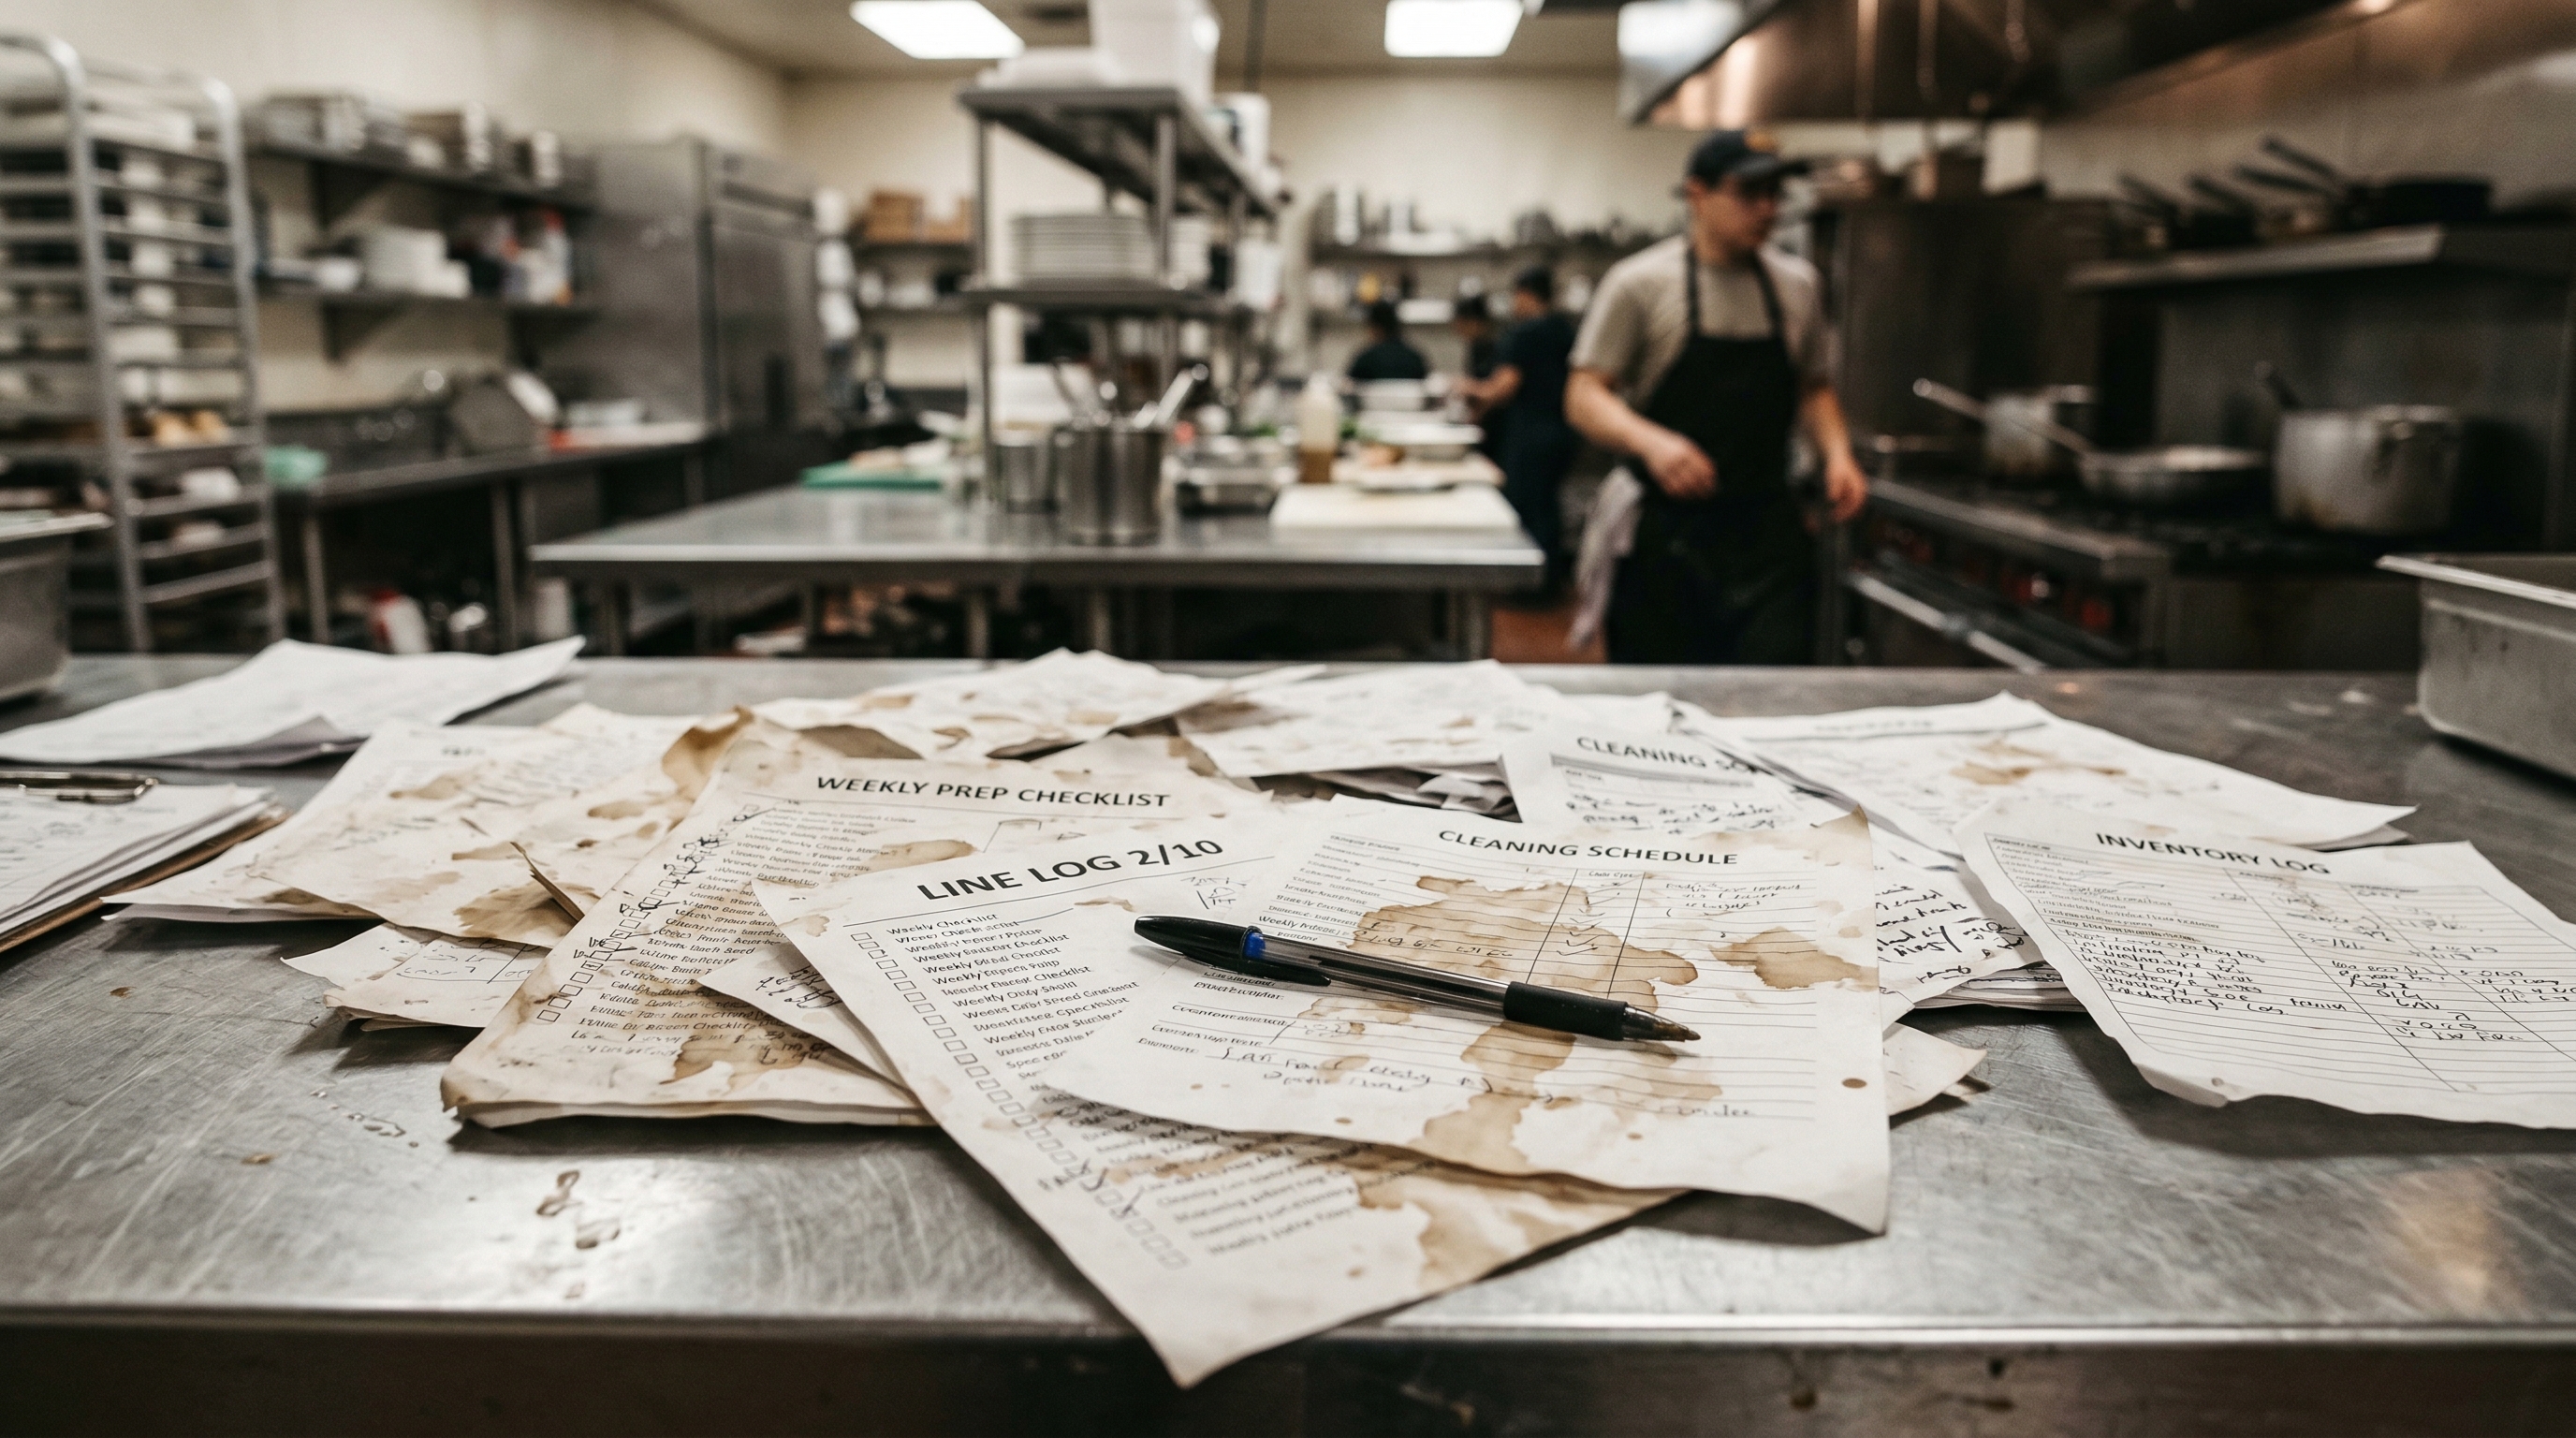
The answer isn’t what most people expect. It’s not dirty kitchens. It’s not food stored at the wrong temperature. The number one reason businesses lose their rating is paperwork.
The Numbers
Of the 475,326 businesses in the FSA dataset:
| Rating | Businesses | Percentage |
|---|---|---|
| 5 (very good) | 370,931 | 78.0% |
| 4 (good) | 63,348 | 13.3% |
| 3 (generally satisfactory) | 26,889 | 5.7% |
| 2 (improvement necessary) | 6,915 | 1.5% |
| 1 (major improvement necessary) | 6,373 | 1.3% |
| 0 (urgent improvement required) | 870 | 0.2% |
Just over 3 in 4 businesses hold the top rating. But 14,158 businesses — around 3% — are rated 2 or below. That’s the group we wanted to understand.
The Three Areas EHOs Score
Every food hygiene inspection scores three areas. Each area is scored on a points system where lower is better:
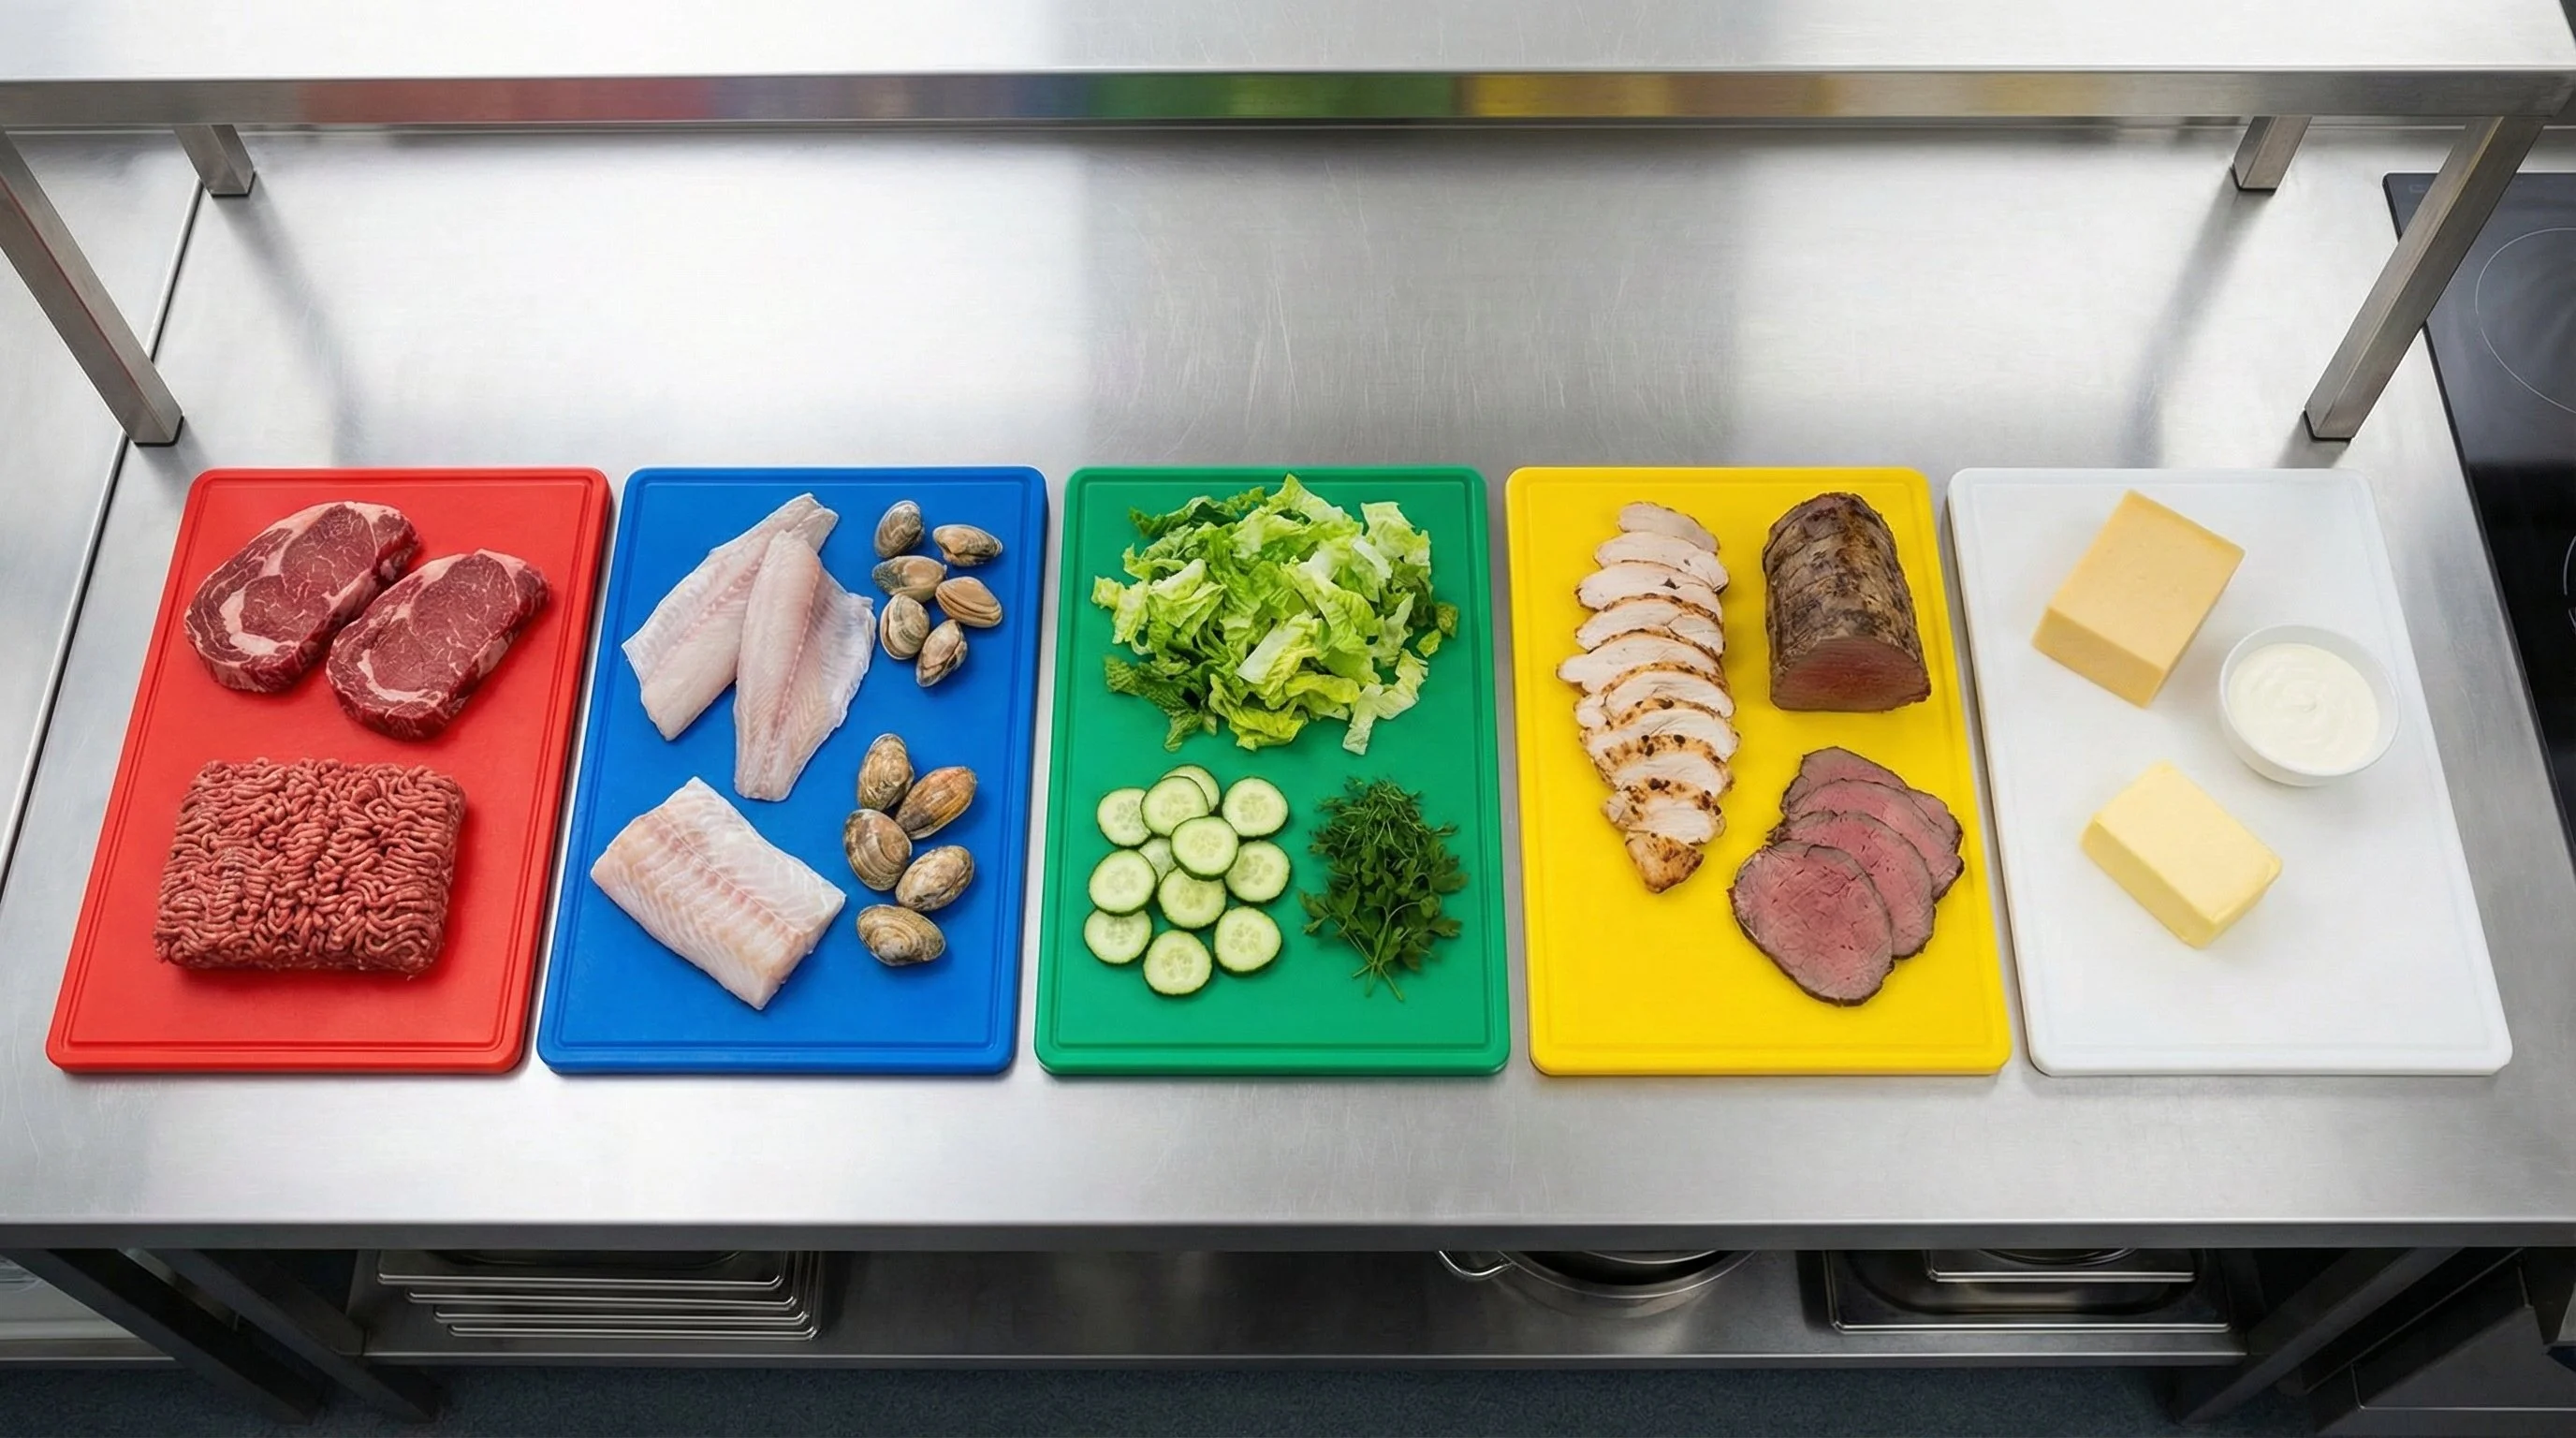
- Food Hygiene and Safety Procedures (0-25 points) — how food is handled, cooked, cooled, and stored. Temperature control, cross-contamination, personal hygiene.
- Structural Compliance (0-25 points) — the physical condition of the premises. Cleanliness, equipment, pest control, hand wash facilities.
- Confidence in Management (0-30 points) — whether the business has a food safety system and is actually using it. Record keeping, training, HACCP documentation.
The third area carries the most weight. It’s also where businesses lose the most points.
Confidence in Management Is the #1 Reason Businesses Fail
Across the 14,158 businesses rated 0, 1, or 2, we looked at which area contributed the most points to their score:
| Worst Area | Businesses | Percentage |
|---|---|---|
| Confidence in Management | 6,244 | 44% |
| Structural Compliance | 4,394 | 31% |
| Food Hygiene Procedures | 1,870 | 13% |
| Tied (multiple areas equally bad) | 1,650 | 12% |
Nearly half of all failing businesses lose the most points on confidence in management. Not on how they handle food. Not on the state of their building. On whether they have a system in place and can prove they’re using it.
What does “confidence in management” actually mean in practice? It’s the area that covers:
- Whether you have a documented food safety management system (HACCP or SFBB)
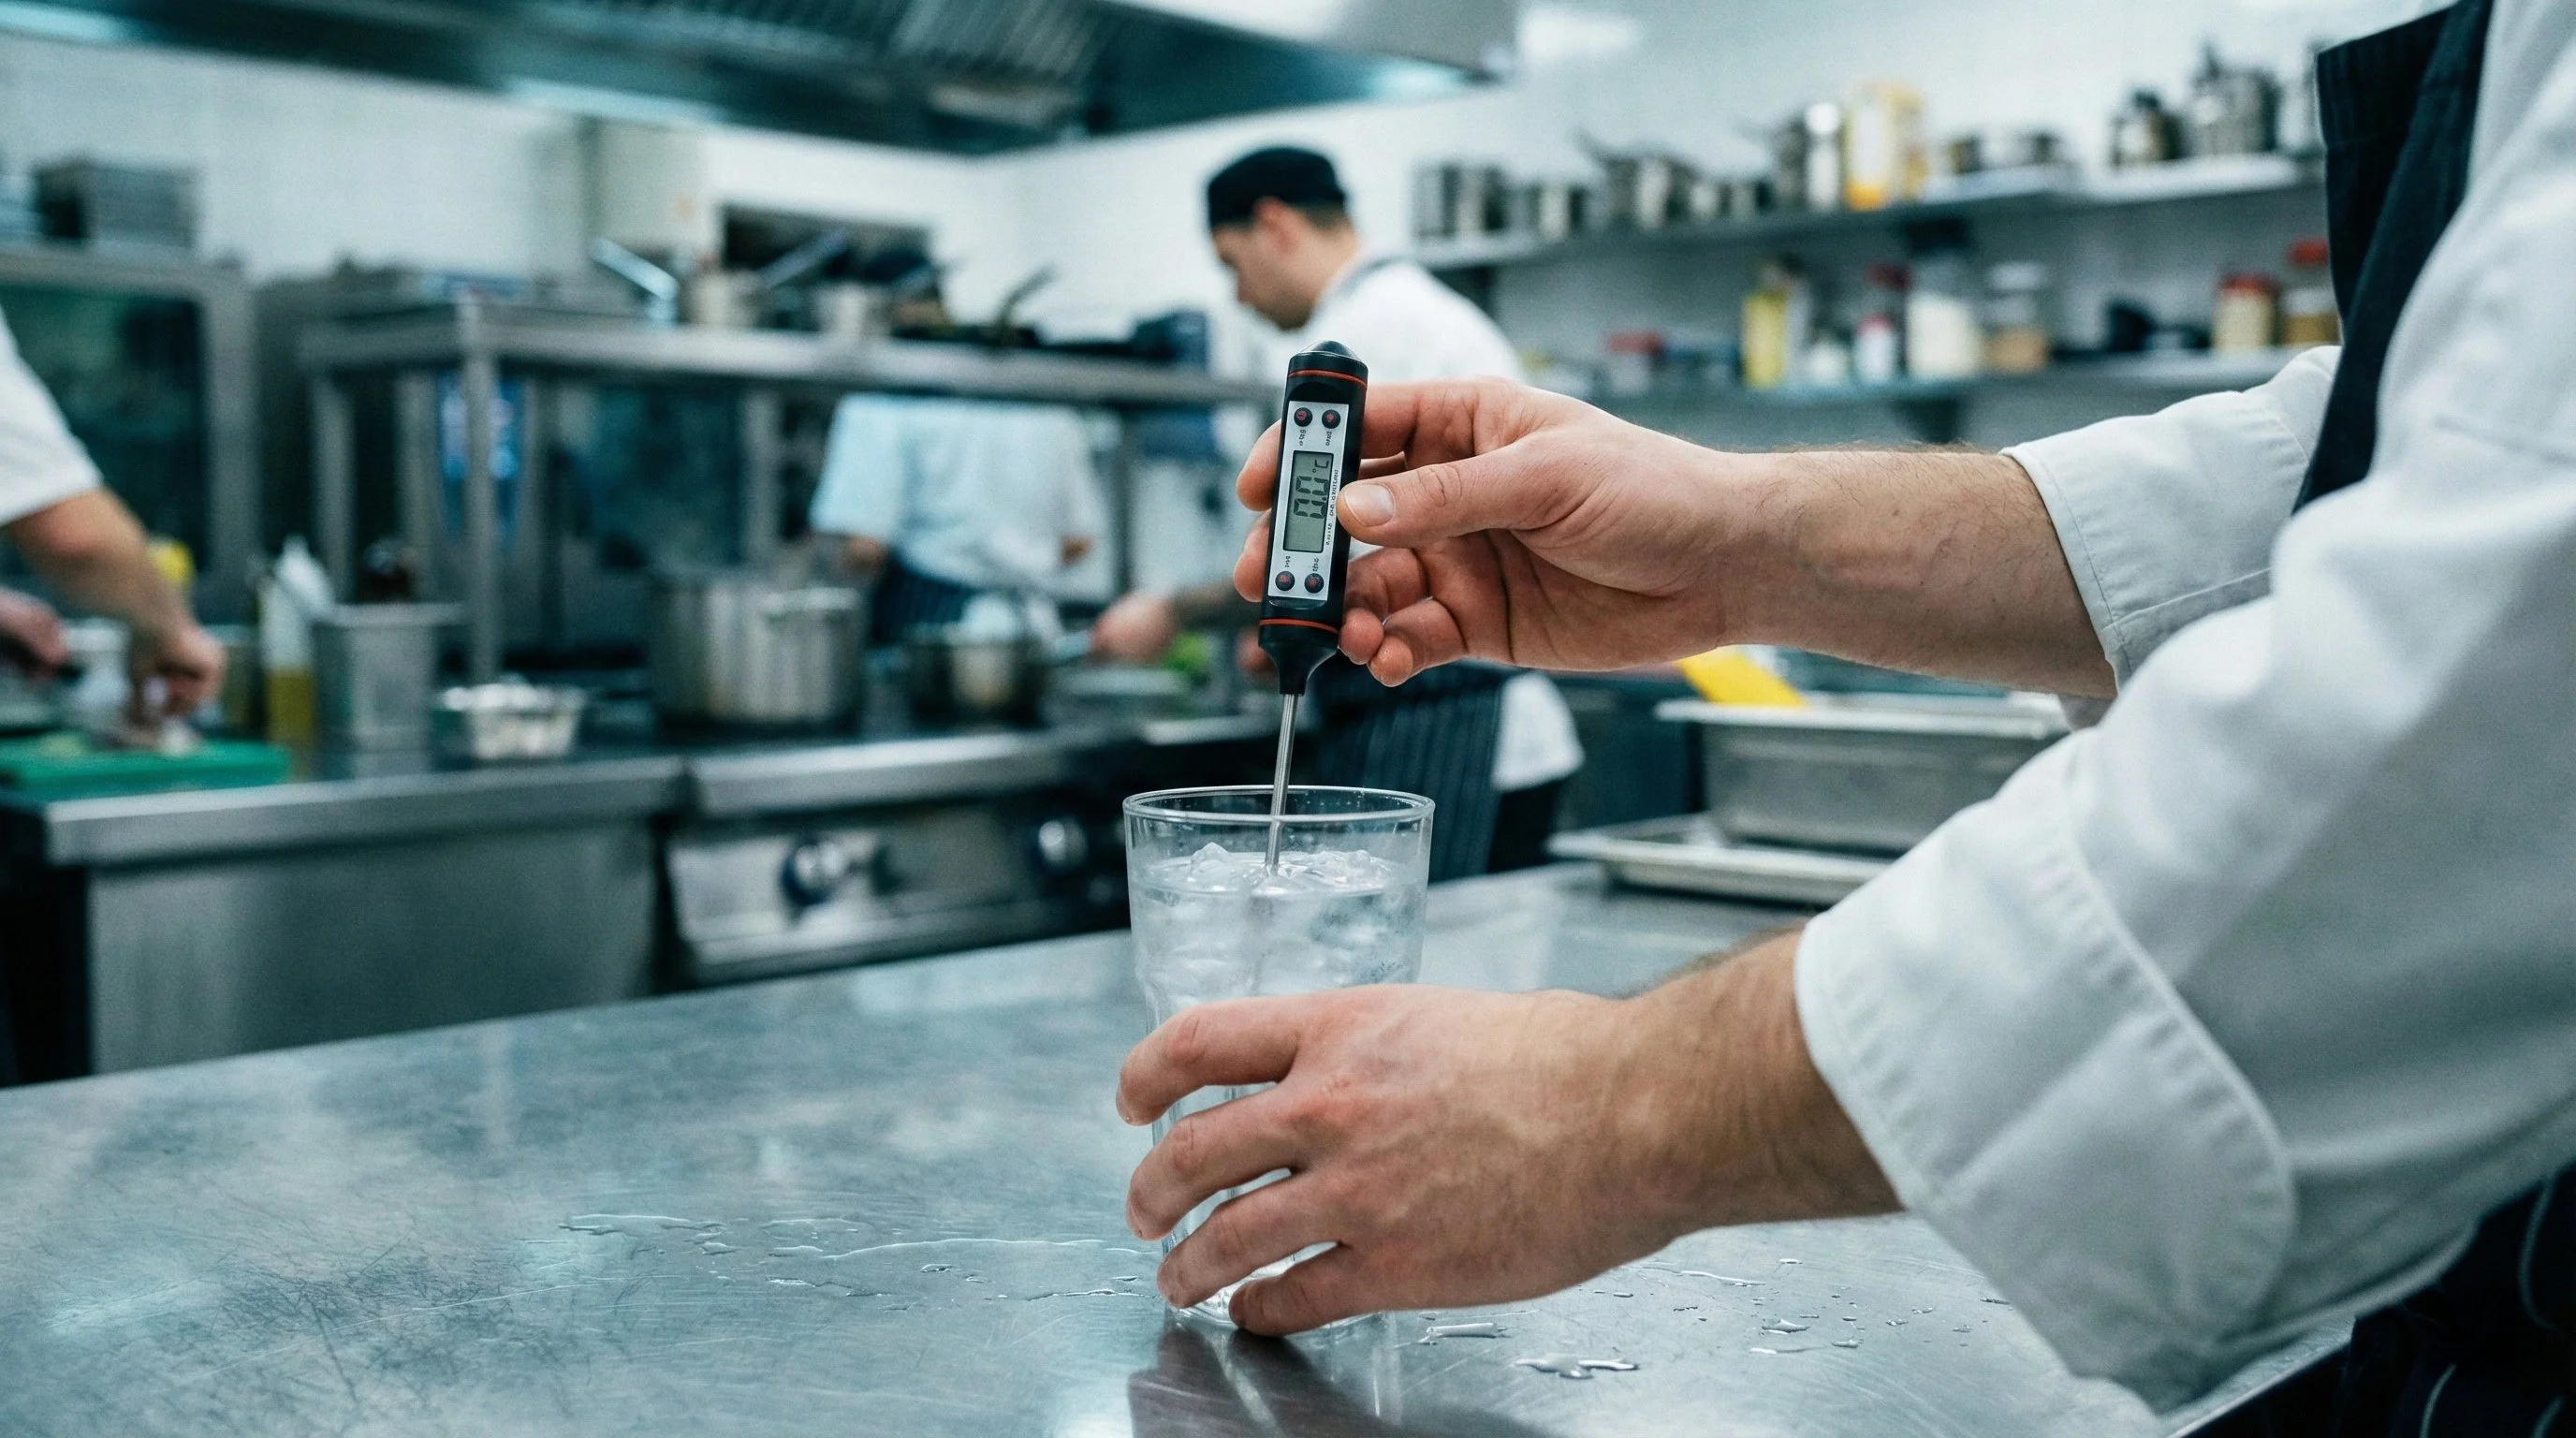
- Whether your temperature logs are filled in every day with no gaps
- Whether your cleaning schedules are completed and signed off
- Whether your staff have food hygiene training certificates on file
- Whether you’ve acted on previous EHO recommendations
In other words, it’s not about whether your kitchen is clean right now. It’s about whether you can prove it’s been clean consistently.
What the Scores Look Like at Each Rating Level
The average scores across all three areas at each rating level reveal a clear pattern:
| Rating | Avg Hygiene (0-25) | Avg Structural (0-25) | Avg CiM (0-30) |
|---|---|---|---|
| 5 | 1.9 | 2.6 | 2.4 |
| 4 | 4.4 | 6.3 | 7.1 |
| 3 | 9.0 | 9.3 | 9.6 |
| 2 | 10.5 | 13.2 | 9.4 |
| 1 | 10.8 | 11.8 | 19.7 |
| 0 | 17.9 | 19.2 | 24.9 |
Look at the jump from rating 4 to rating 1. Hygiene barely moves (4.4 to 10.8). Structural goes up moderately (6.3 to 11.8). But confidence in management nearly triples (7.1 to 19.7).
Businesses rated 0 score an average of 24.9 out of 30 on confidence in management. That’s near-total non-compliance — no food safety system, no records, no evidence of training.
What Separates a 5 From a 4?
Most businesses want to know: what do I need to do to get from a 4 to a 5? The data gives a clear answer.
| Area | 5-Rated Average | 4-Rated Average | Gap |
|---|---|---|---|
| Hygiene | 1.9 | 4.4 | 2.5 |
| Structural | 2.6 | 6.3 | 3.7 |
| CiM | 2.4 | 7.1 | 4.7 |
The biggest gap is confidence in management — a difference of 4.7 points. Businesses rated 4 are generally handling food safely and keeping their premises in reasonable condition. What they’re missing is the documentation to prove it.
In fact, 26,160 businesses currently rated 4 scored well on both hygiene and structural compliance but lost their 5 solely because of confidence in management. That’s 41% of all 4-rated businesses. They’re running clean, safe kitchens — they just can’t prove it on paper.
That means the difference between a 4 and a 5 often comes down to:
- Filling in your temperature log every single day, not most days
- Having a completed cleaning schedule with sign-offs, not just a blank template on the wall
- Keeping training records filed and accessible, not locked in a drawer somewhere
- Running your opening and closing checks consistently, not just when you remember
Which Businesses Fail Most?
Not all food businesses are equally likely to score low. We looked at failure rates (rated 0-2) by business type:
| Business Type | Low-Rated | Total | Fail Rate |
|---|---|---|---|
| Takeaway/sandwich shop | 2,952 | 50,915 | 5.8% |
| Retailers - other | 4,467 | 86,412 | 5.2% |
| Restaurant/Cafe/Canteen | 3,945 | 115,089 | 3.4% |
| Pub/bar/nightclub | 971 | 43,630 | 2.2% |
| Supermarkets | 288 | 13,990 | 2.1% |
| Manufacturers/packers | 138 | 7,438 | 1.9% |
| Mobile caterers | 319 | 22,675 | 1.4% |
| Other catering | 510 | 54,014 | 0.9% |
| Hospitals/childcare/caring | 245 | 35,373 | 0.7% |
| Schools/colleges | 145 | 30,825 | 0.5% |
Takeaways have the highest fail rate at 5.8% — nearly 1 in 17. Schools have the lowest at 0.5%. This likely reflects the level of food safety infrastructure: schools and hospitals typically have dedicated compliance staff and formal systems, while takeaways are often owner-operated with less administrative support.
What This Means for Your Business
The data tells a simple story: the businesses that fail are the ones that can’t prove they’re doing things right.
You might have the cleanest kitchen in your postcode. But if you can’t show the EHO three months of temperature logs, a completed cleaning schedule, and an up-to-date HACCP plan, you’re going to lose points on confidence in management — and that’s the area that costs businesses their rating more than any other.
The fix isn’t complicated:
- Use a food safety management system — whether it’s SFBB, a HACCP plan, or a digital system like Forkto
- Complete your records every day — temperature logs, cleaning schedules, opening and closing checks
- Keep training records on file — certificates for every food handler, dated and accessible
- Run a self-audit — use our EHO Inspection Prep Checklist to check yourself against the same criteria inspectors use
- Act on issues and document it — if something goes wrong, record what happened and what you did about it
Free Checklists
We’ve created free printable checklists covering the areas EHOs assess:
- EHO Inspection Prep Checklist — 56-item self-audit across all three scored areas
- Fridge & Freezer Temperature Log — monthly daily temperature recording
- Kitchen Opening & Closing Checklist — daily BOH and FOH shift tasks
- BOH Daily Cleaning Schedule — kitchen cleaning with weekly sign-off
- FOH Daily Cleaning Schedule — front-of-house cleaning with weekly sign-off
- Pest Control Inspection Checklist — pest activity and prevention checks
- Staff Uniform Checklist — uniform compliance checks
Further reading
- Food Safety Trends 2026 — the wider regulatory and enforcement context
- UK Food Recalls & Fines 2026 Report — named prosecutions with £ figures
- How to Get a 5-Star Food Hygiene Rating — the full FHRS scoring framework
Methodology
We analysed 475,326 FHRS-rated businesses across all 363 local authorities in England, Wales, and Northern Ireland, filtered to those with complete scores across all three areas (Hygiene, Structural, Confidence in Management). Scottish authorities use a separate pass/fail scheme (FHIS) and are not included. The dataset reflects the most recent rating for each registered establishment and may include businesses that have since closed.
Go Digital
The data is clear: the single biggest thing you can do to protect your food hygiene rating is keep consistent, complete records. With Forkto, your temperature logs, cleaning schedules, and daily checks are digital, timestamped, and always ready for inspection. No gaps, no lost paperwork, no guesswork. Start your free 14-day trial.
Food safety, sorted
Stop running food safety on paper
Forkto turns daily checks, temperature logs, HACCP and audits into a few taps on a phone—so your team stays consistent and you're always ready for the EHO.
14-day free trial · No card required